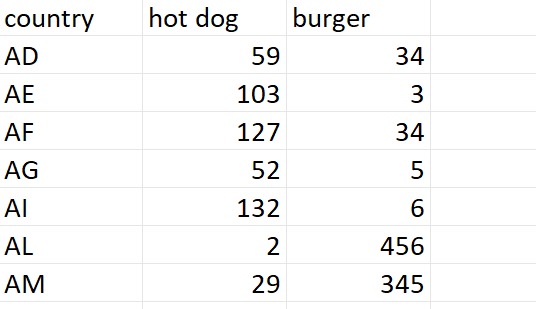
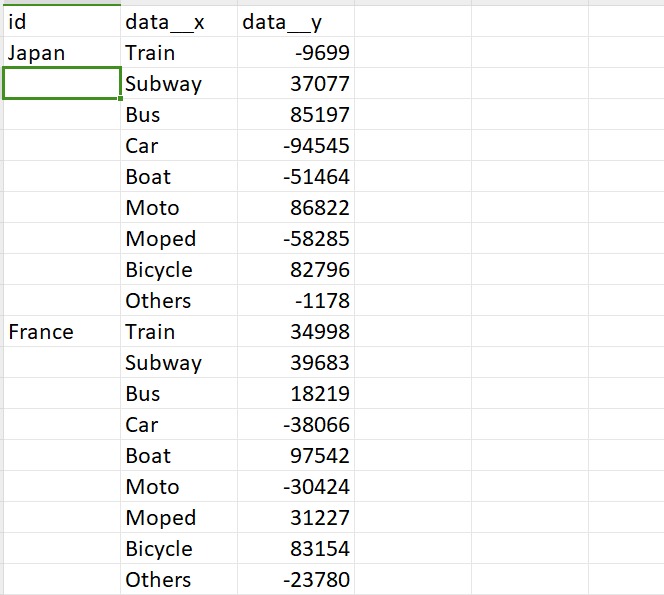
Bar chart
Perfect for comparing quantities across different categories

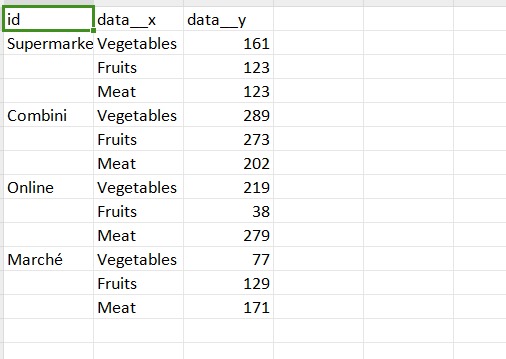
Learn about the required data format for each chart type
Perfect for comparing quantities across different categories
Ideal for showing trends over time or continuous data
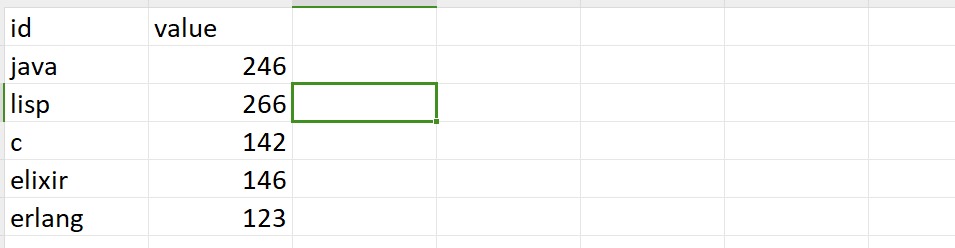
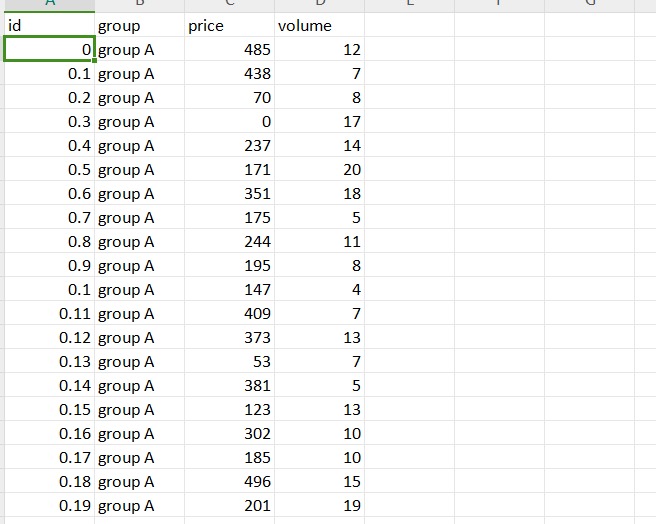
Best for showing proportions of a whole
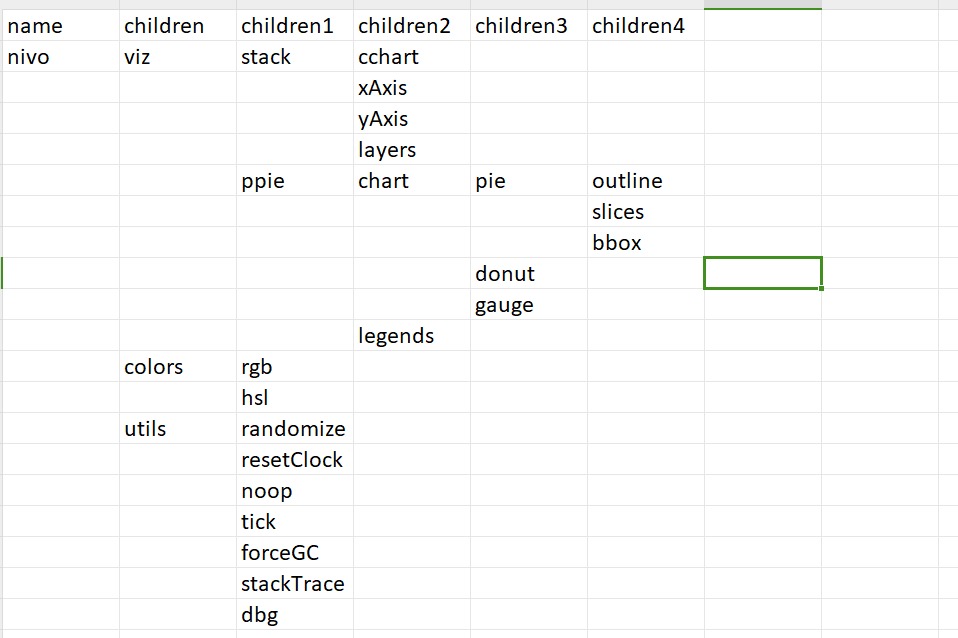
Visualize hierarchical data structures and relationships
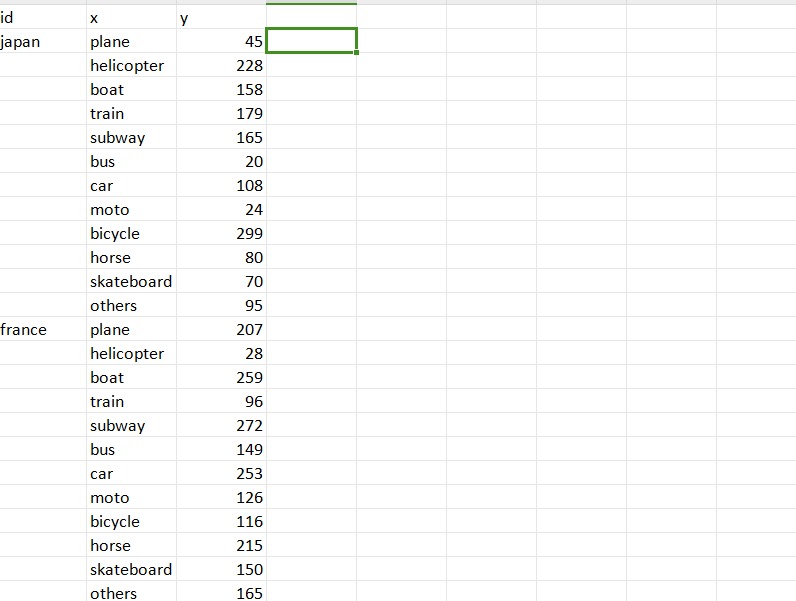
Display data density and patterns across multiple variables
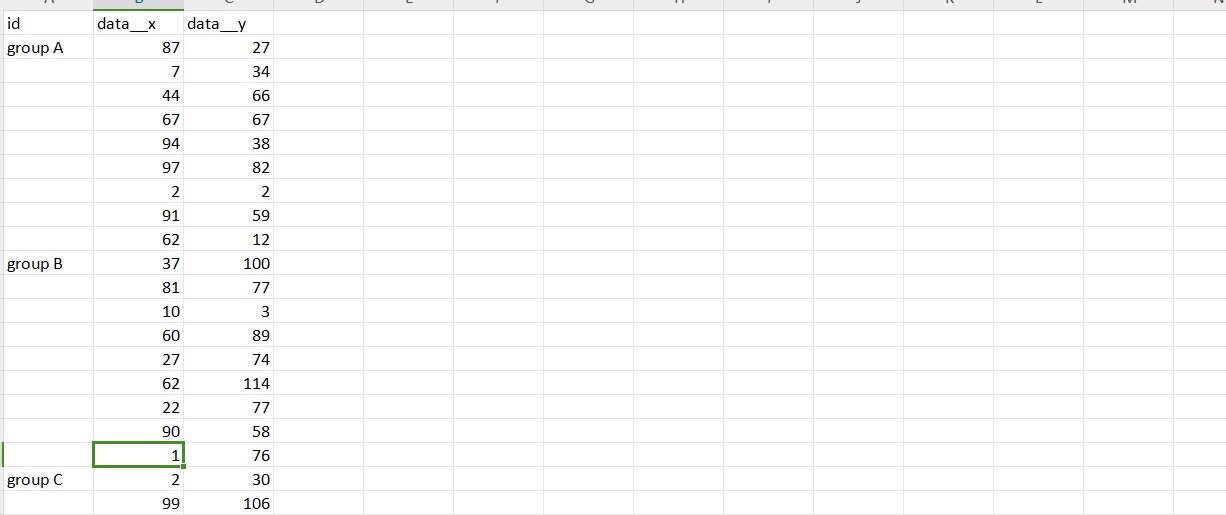
Show correlation between two variables
Display distribution of data points with no overlapping
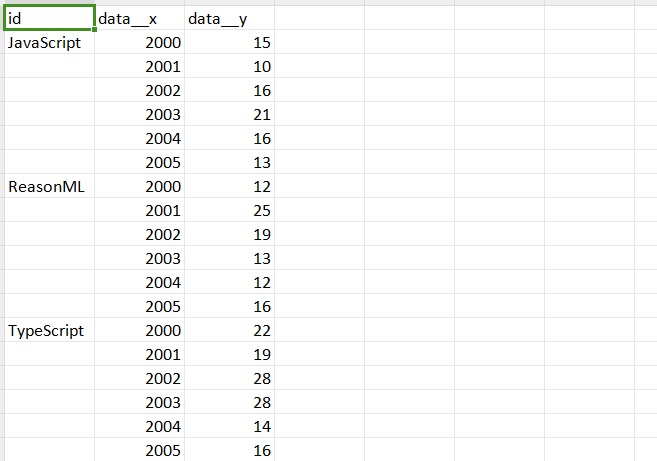
Show changes in ranking or values over time
Circular version of a bar chart, good for cyclical data